 1800 605-5127
 +61 (0)8 8352 7711
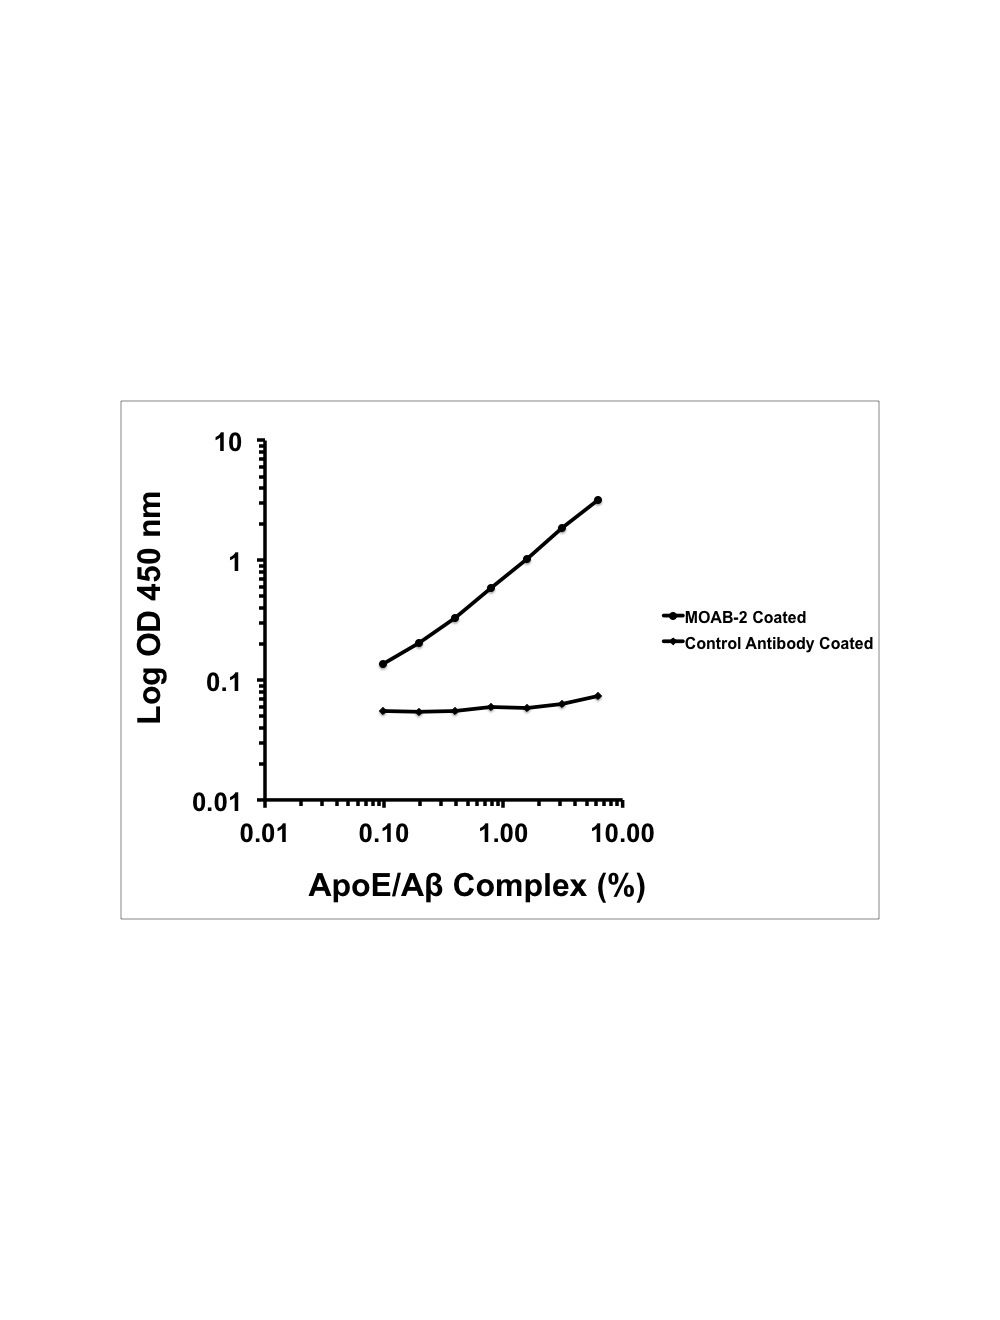

Apolipoprotein E/beta-Amyloid Complex (ApoE/A beta), Human, ELISA assay
As low as
US$398.50
Only %1 left
Catalog Number
BEK-2224
- Product Name Apolipoprotein E/beta-Amyloid Complex (ApoE/A beta), Human, ELISA assay
-
Product Description
Biosensis is proud to offer the first commercially available ApoE/β-amyloid (ApoE/Aβ) complex ELISA kit. As a result of extensive collaboration with Dr. LaDu's laboratory at UIC and validation by Biosensis, this ELISA can be used to accurately and consistently measure the extent of ApoE/Aβ complex in tissue extracts and other samples. The Biosensis ApoE/Aβ Complex ELISA kit is a sandwich ELISA and consists of a pre-coated mouse monoclonal anti-Aβ capture antibody, a highly validated ApoE/Aβ complex standard that is pre-formed, lyophilized and ready for reconstitution, a biotinylated ApoE detection antibody, and horseradish peroxidase (HRP)-conjugated streptavidin and detection reagent. The addition of a substrate (3,3',5,5'-tetramethylbenzidine, TMB) yields a colored reaction product which is directly proportional to the level of ApoE/Aβ complex present in samples and protein standards. Importantly, a well-characterized and unique ApoE/Aβ complex is included as a standard. This complex is pre-formed and lyophilized, requiring only reconstitution with assay diluent prior to use. In order to assess non-specific ApoE protein binding, each kit includes additional plates pre-coated with control antibody.
The purpose of this kit is the in vitro qualitative measurement of ApoE/Aβ complexes in brain extracts and CSF samples from both transgenic mice and humans or primates, relative to a known ApoE/Aβ complex standard, only if used as directed. This kit has not been tested for other sample applications. This kit has been configured for research use only and is not to be used in diagnostic or clinical procedures. - Alternative Names ApoE; Beta-APP42; Beta-APP40; Beta-amyloid protein 42; Beta-amyloid protein 40; ABPP; APPI; Amyloid beta A4 protein; MOAB2; MOAB-2; Alzheimer's antibody; AB40; AB42; abeta.
- Application(s) ELISA
- Specificity Human Apolipoprotein E/beta-Amyloid (ApoE/A beta) Complex. The kit has been assayed on human samples only but the capture antibody, MOAB-2, is know to react with rodent amyloid beta though weaker (20% less reactivity on dot blots). The polyclonal APOE used for detection should detect ApoE from a variety of species but so far has only been tested on human
- Species Reactivity Human
- Immunogen Description Complex of E.coli-derived recombinant human ApoE protein and synthetic, monomerized Abeta (1-42) peptide
- Range 0.1 - 6.25%
- Regulatory Status For research use only.
Product Info
-
Product Description
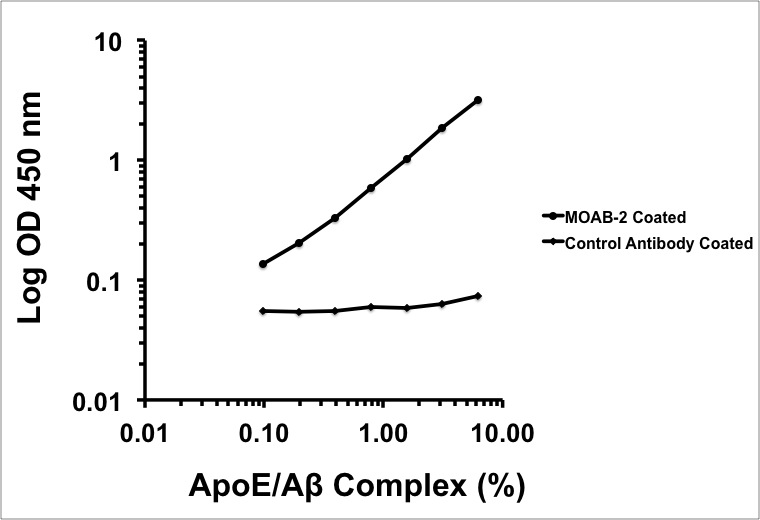
Biosensis is proud to offer the first commercially available ApoE/β-amyloid (ApoE/Aβ) complex ELISA kit. As a result of extensive collaboration with Dr. LaDu's laboratory at UIC and validation by Biosensis, this ELISA can be used to accurately and consistently measure the extent of ApoE/Aβ complex in tissue extracts and other samples. The Biosensis ApoE/Aβ Complex ELISA kit is a sandwich ELISA and consists of a pre-coated mouse monoclonal anti-Aβ capture antibody, a highly validated ApoE/Aβ complex standard that is pre-formed, lyophilized and ready for reconstitution, a biotinylated ApoE detection antibody, and horseradish peroxidase (HRP)-conjugated streptavidin and detection reagent. The addition of a substrate (3,3',5,5'-tetramethylbenzidine, TMB) yields a colored reaction product which is directly proportional to the level of ApoE/Aβ complex present in samples and protein standards. Importantly, a well-characterized and unique ApoE/Aβ complex is included as a standard. This complex is pre-formed and lyophilized, requiring only reconstitution with assay diluent prior to use. In order to assess non-specific ApoE protein binding, each kit includes additional plates pre-coated with control antibody.
The purpose of this kit is the in vitro qualitative measurement of ApoE/Aβ complexes in brain extracts and CSF samples from both transgenic mice and humans or primates, relative to a known ApoE/Aβ complex standard, only if used as directed. This kit has not been tested for other sample applications. This kit has been configured for research use only and is not to be used in diagnostic or clinical procedures. -
Related Products
Oligomeric Amyloid-beta, Human, Rat, ELISA assay
- Application(s) ELISA
- Application Details ELISA. For the quantification of Apolipoprotein E/beta-Amyloid Complex (ApoE/A beta) in CSF, Tissue Homogenates. Please download the detailed product insert for complete instructions for the successful use of this ELISA. Use only as directed.
- Target Apolipoprotein E/beta-Amyloid Complex (ApoE/A beta)
- Specificity Human Apolipoprotein E/beta-Amyloid (ApoE/A beta) Complex. The kit has been assayed on human samples only but the capture antibody, MOAB-2, is know to react with rodent amyloid beta though weaker (20% less reactivity on dot blots). The polyclonal APOE used for detection should detect ApoE from a variety of species but so far has only been tested on human
- Target Host Species Human
- Species Reactivity Human
- Immunogen Description Complex of E.coli-derived recombinant human ApoE protein and synthetic, monomerized Abeta (1-42) peptide
- Range 0.1 - 6.25%
- Sample Type CSF, Tissue Homogenates
- Detection Method Colorimetric
- Kit Components The ELISA kit box contains 2 x 96-well pre-coated strip plates per 1 Plate Kit (1 plate MOAB-2 antibody coated, 1 plate control antibody coated), protein standards, detection reagents, wash and sample buffers, substrate buffer and detailed protocols.
- Storage Instructions Store at 2-8°C.
- Storage Temperature 2-8°C
- Batch Number Please see item label.
- Expiration Date 12 months from purchase.
- Alternative Names ApoE; Beta-APP42; Beta-APP40; Beta-amyloid protein 42; Beta-amyloid protein 40; ABPP; APPI; Amyloid beta A4 protein; MOAB2; MOAB-2; Alzheimer's antibody; AB40; AB42; abeta.
- Uniprot Number P02649
- Uniprot Number/Name P02649 (APOE_HUMAN)
- Shipping Statement For order quantities larger than 1 plate, this product is supplied in package units of 2 plates.
- Shipping Temperature 2-8°C (on cold packs)
- UNSPSC CODE 41116158
- Regulatory Status For research use only.
Specifications
-
Specific References
Tai LM et al. (2013) J Biol Chem. 288(8): 5914-26
Tai LM et al. (2014) Mol Neurodegen. 9:2
-
General References
Review:
Tai LM et al (2015). APOE-modulated Aβ-induced neuroinflammation in Alzheimer's disease: current landscape, novel data, and future perspective.J Neurochem. 133(4):465-88.